The UnSustainability Report 2023 – DK

10 barriers for a sustainable transition in Denmark

DK / NO / SE

barriers for a sustainable transition in Denmark

10

If we are going to save the planet, biodiversity and the future, we need to change the world and do it fast.

On that, we can all agree.

It means making our lives, businesses and societies sustainable.

But how do we do that?

Most people are happy to discuss objectives, future technologies and ambitions.

However, in this report, we venture beyond the usual sustainability rhetoric. We do not focus on all the things that will make the world more sustainable in the future.

Instead, we focus on what makes us less sustainable today, from bad habits and inept systems to paper pushers and red tape.

Sorry for spoiling the mood.

Future sustainability reporting is going to do the same.

We will stop reporting on all the good things we want to do and be honest about what we haven’t achieved yet.

This report highlights ten barriers to sustainable transition in Denmark. Many are expensive items on the climate account; others will impact our confidence in sustainable development. All of them are sore points that need to be addressed.

We hope you enjoy reading The UnSustainability Report.

Presented by

The UnSustainability Report

The UnSustainability Report is made by Geelmuyden Kiese and Deloitte Economics. The report is based on extensive research, interviews and quantification of the barriers we have identified. This is what we did:

1 RESEARCH: Initially, we identified the sectors of society that need to make the most significant CO2 reductions if Denmark is to meet its climate goals. This includes agriculture, transport and manufacturing, among others. We also identified which technologies we are counting on to meet these reduction targets - for example, Carbon Capture & Storage (CCS) and Power-to-X. All this was based on the Danish Energy Agency’s annual climate projections.


Our starting point was; if we could identify the barriers for precisely these sectors and technologies, these would also be the barriers that will significantly affect sustainable transition in Denmark.


2. INTERVIEWS: We interviewed experts, business leaders and industry representatives. The interviewees were selected based on the identified sectors and technologies mentioned above. We also conducted additional desk research based on the interviewees’ views.

3. IDENTIFICATION AND QUANTIFICATION OF THE BARRIERS: We identified several barriers to sustainable transition using data from our interviews and desk research. In collaboration with Deloitte Economics, we selected ten barriers to include in the report. The selection was based on an overall assessment of our interview data and desk research data. It was possible to then quantify six of the ten barriers in relation to the potential for CO2 reductions by a given intervention.


What do we mean by sustainability – and ‘unsustainability’?
We use the UN definition of sustainability presented by the Brundtland Commission in 1987. The definition means development that ‘meets the needs of the present generations without compromising the ability of future generations to meet their own needs’. Consequently, we also use a broad definition of sustainability which, for this report, is limited to sustainability within the areas of environment, climate and biodiversity, including our national climate goals. Therefore, we define ‘unsustainability’ as the barriers that impede the achievement of our national climate goals and/or negatively affect the ability of society, businesses and citizens to meet their own needs while respecting the ability of future generations to meet theirs.

Waiting time for transition: About a decade

1

1

Hello there. You’ve reached the green transition. Our current waiting time is 11 years. Across the country, businesses and individuals are ready to kick-start green energy projects. But they are being held back by a Kafkaesque bureaucracy that renders Denmark’s 2030 goals impossible.

What can be achieved in 9 years? If you’re NASA, you can develop the world’s biggest rocket and send it to the moon1. Meanwhile, if you’re in Denmark, it’s barely possible to build a small offshore wind farm off the coast of Møn.

Building an offshore wind farm takes nine to eleven years, and things don’t move much faster on land2.

The reason for this is not a lack of ambition or skills. Instead, it is due to processing times, complicated requirements and approval procedures for the various projects. In short: Red tape. Kafkaesque systems that slow down Denmark’s 2030 plans.

The Danish climate goals must be reached in seven years; renewable energy is crucial. That is why the government and parliament have agreed that by 2030 we must have quintupled electricity production from offshore wind turbines and quadrupled the production from onshore wind turbines and solar cells.

Bureaucracy and inefficient processes are holding back the green transition, and that is not good for businesses and citizens.

Lars Sandahl Sørensen, CEO, Confederation of Danish Industry

But at the current pace, we will not reach our goal, says the Confederation of Danish Industry, among others. The message from industry is clear: We need less hassle, less bureaucracy and more predictability - otherwise, renewable energy will go far beyond the climate goal’s sell-by date3:

‘We need to speed up the expansion of renewable energy to have 100% green energy by 2030. Building an offshore wind farm takes almost nine years, and we must be driven to do it in half that time. Bureaucracy and inefficient processes are holding back the green transition, which is not good for businesses and citizens when we need cheap energy more than ever, says Lars Sandahl Sørensen, CEO of the Confederation of Danish Industry.

Our calculations indicate that if we speed up the roll-out of renewable energy, the CO2 gain would be substantial: an additional annual CO2 reduction of 750,063 tonnes on average and an effect over seven years up to 2030 of 5,250,443 tonnes in total.

Bureaucratic red tape leaves the green transition waiting

5.250.443 tonnes

By 2030, CO2 emissions could be reduced by this amount.

Read more +

Long processing and approval times are slowing down renewable energy development.

Deloitte Economics

5.250.443 tonnes

This is the amount by which CO2 emissions could be reduced by 2030.

We’ll need to seriously accelerate to achieve our ambition of quadrupling wind and solar electricity production and quintupling offshore wind production by 2030. If we imagine increasing the pace, we can install 50% more new renewable energy sources per year by 2030. The CO2 gain would be substantial: an additional annual CO2 reduction of 750,063 tonnes on average and a total effect over seven years up to 2030 of 5,250,443 tonnes of CO2 reduction for the climate.

This is what we did

What would be the impact of removing sufficient administrative burdens (mostly permit procedures) in order to accelerate the deployment of the current renewable e-energy pipeline by 50%?

Starting point:

• Annual onshore wind installations of 0.6 GW (Wind Europe 2022-2026 forecast, 2022)

• Annual offshore wind installations of 1.3 GW (Wind Europe 2022-2026 forecast, 2022)

• Annual solar cell installations of 3.8 GW (Solar Power Europe 2021-2030 forecast, 2021)

• The carbon intensity of the electricity grid is 190.5 kg CO2-equivalent MWh (included in energy imports), decarbonisation by 11.4% per year (Ecoinvent 2022, European Energy Agency 2022)

Assumed intervention:

• Removing the administrative burden makes it possible to accelerate the planned development of renewable energy projects by half, allowing 50% additional capacity to come online annually until 2030.

• Capacity factors are assumed to be 25% for onshore wind, 50% for offshore wind, 12% for solar cells and 51% for hydro (IEA, 2022).

Estimated effect:

• Using the European Energy Agency emissions accounting methodology, renewable sources are assumed to provide GHG-free electricity.

• Only the impact of the incremental 50% renewable electricity capacity is included (net figure from the assumed continued decarbonisation efforts in each country which is included in the baseline)

Limitations:

• In accordance with the European Environment Agency and the Greenhouse, the life cycle assessment of emissions from renewable energy assets (emissions linked to the production and installation of the assets) is not taken into account. These emissions depend a great deal on where the components are manufactured.

The 50% increase in development capacity is an arbitrary assumption, which is made as part of a hypothesis development and not supported by research.

Nine years to complete wind power

Construction of an offshore wind farm off the coast of Møn started in 2012. It was completed nine years later, in 2021. In 2018, the Thor offshore wind farm construction off the west coast of Jutland was approved. The wind turbines are expected to be in operation by 2027.

2018

2019

2020

2021

2022

2024

2025

2026

2023

2027

2012

2013

2014

2015

2016

2018

2019

2020

2017

2021

Thor offshore wind farm

Kriegers Flak offshore wind farm

We’ll need to seriously accelerate to achieve our ambition of quadrupling wind and solar electricity production and quintupling offshore wind production by 2030. If we imagine increasing the pace, we can install 50% more new renewable energy sources per year by 2030. The CO2 gain would be substantial: an additional annual CO2 reduction of 750,063 tonnes on average and a total effect over seven years up to 2030 of 5,250,443 tonnes of CO2 reduction for the climate.

This is what we did

What would be the impact of removing sufficient administrative burdens (mostly permit procedures) in order to accelerate the deployment of the current renewable e-energy pipeline by 50%?

Starting point:

• Annual onshore wind installations of 0.6 GW (Wind Europe 2022-2026 forecast, 2022)

• Annual offshore wind installations of 1.3 GW (Wind Europe 2022-2026 forecast, 2022)

• Annual solar cell installations of 3.8 GW (Solar Power Europe 2021-2030 forecast, 2021)

• The carbon intensity of the electricity grid is 190.5 kg CO2-equivalent MWh (included in energy imports), decarbonisation by 11.4% per year (Ecoinvent 2022, European Energy Agency 2022)

Assumed intervention:

• Removing the administrative burden makes it possible to accelerate the planned development of renewable energy projects by half, allowing 50% additional capacity to come online annually until 2030.

• Capacity factors are assumed to be 25% for onshore wind, 50% for offshore wind, 12% for solar cells and 51% for hydro (IEA, 2022).

Estimated effect:

• Using the European Energy Agency emissions accounting methodology, renewable sources are assumed to provide GHG-free electricity.

• Only the impact of the incremental 50% renewable electricity capacity is included (net figure from the assumed continued decarbonisation efforts in each country which is included in the baseline)

Limitations:

• In accordance with the European Environment Agency and the Greenhouse, the life cycle assessment of emissions from renewable energy assets (emissions linked to the production and installation of the assets) is not taken into account. These emissions depend a great deal on where the components are manufactured.

The 50% increase in development capacity is an arbitrary assumption, which is made as part of a hypothesis development and not supported by research.

Deloitte Economics

5.250.443 tonnes

This is the amount by which CO2 emissions could be reduced by 2030.

2

Number of cars is increasing

2

Since 2000, Danes have purchased considerably more cars. About 850,000 more, or what corresponds to an increase of 46 percent5. This is much more than can be rationally explained based solely on logistics. At the same time, we have not seen a similar explosive population growth that could explain why more of us need to travel now. On average, there are only 1.08 people in the car when commuting to and from work6. Denmark hasn’t suddenly grown fourfold, and the distances haven’t increased. The conclusion is obvious: The Danes love cars, and we would rather have as few passengers in them as possible.

Every year, 75,000 new cars make their way to Danish roads7. At the same time, more than 19% of Danish families have more than one car, and the number is growing8. However, if we just added a few more passengers to the ones we already have instead of buying more cars, according to our calculations, there would be significant CO2 reductions.

“There are still too many new cars being purchased in Denmark, and the transition of the transport sector is not happening at the needed pace. The sale of new combustion engine cars should be phased out, and we should promote better use of cars and roads through taxes, among other things. This would also make most planned motorway projects redundant,” says Søren Have, Programme Manager for Future Mobility at Concito.

We love the green transition – and a second car

7.537.289 tonnes

By 2030, CO2 emissions could be reduced by this amount.

Read more +

The estimated increase in the number of cars on the roads in Denmark by 2035 (source: Danish Energy Agency).

Inventory of cars 2020-2035

The Danish car fleet is growing and, for the time being, it will include diesel and petrol-fuelled cars.

Two trends are occurring simultaneously: Danes’ commitment to the climate and our purchasing of more vehicles. Although Danes want green initiatives, we like cars more. Since 2000, about a million more cars have found their way to Danish roads. If we took up carpooling, the reduction in CO2 emissions would be up to 7.5 million tonnes by 2030.

It’s a bit paradoxical. If you ask the Danes, the climate is a core political issue. However, the green commitment fades into the background when buying a car, maybe even a second car. We are so fond of cars that emissions from the transport sector are expected to only drop marginally by 2.6% annually up to 2030, even though cars are becoming significantly greener. This is primarily because we purchase more vehicles and travel longer distances in them4. Therefore, transport will account for a larger share of our total emissions in 2030 than 2020, as emissions are reduced in the other sectors.

Deloitte Economics

7.537.289 tonnes

By 2030, CO2 emissions could be reduced by this amount.

Reducing emissions from the transport sector is progressing far too slowly. Today's new petrol and diesel cars will still be on the roads in 15 years. So, it will be very long before all cars are zero-emission cars. Imagine, instead of buying more cars, we just invited more passengers into the ones we already have; the subsequent CO2 reduction would be significant. Calculations from Deloitte Economics demonstrate this. Increasing the average number of car passengers by 25% - from 1.08 passengers to 1.35; would save 1,076,756 tonnes of CO2 annually or just over 7.5 million tonnes by 2030. This is equivalent to approximately the total lifecycle emissions of 2.05 million cars.

This is what we did

By increasing the average seat occupancy by 25% to 1.35 seats per journey, what would be the resulting impact?

Starting point:

• The average commuting distance (round trip) is 44.2 km (Statistics Denmark, 2021 baseline)

• The total number of people commuting to work in Denmark is 2.9 million (Statistics Denmark, 2021 baseline)

• 67% of commuters use their own car to commute (Confederation of Danish Industry, 2021)

• The average passenger occupancy per car while commuting to work is 1.08 (The Danish Road Directorate, 2022)

• Danish workers commute an average of 180 days per year, assuming 16% work remotely (Confederation of Danish Industry, 2022)

Assumed intervention:

• Carpooling is implemented (e.g. dedicated lanes, charge system, tax deductions)

• As a result, the average seat occupancy increases by 25% to 1.35 occupied seats per journey.

Estimated effect:

• As a result of the increase in seat occupancy, the equivalent of 360,000 cars is removed from the daily commute (1.4 million cars commute, compared to 1.8 million), which translates into avoided emissions.

• Avoided emissions are estimated by using life cycle assessment data (i.e. including emissions from vehicle manufacturing, based on Ecoinvent 2022)

Limitations:

• The distribution of fuel and corresponding emissions for the Danish car fleet is estimated based on sales data for 2021 and applied as a fixed variable. • • This generates an overrepresentation of electric vehicles in the first couple of years of the analysis, which should be resorbed over time (this results in more conservative estimates of the impact).

• The 25% increase in seat occupancy is an arbitrary assumption that is part of hypothesis development and is not supported by research.

Carpooling associations come to the rescue

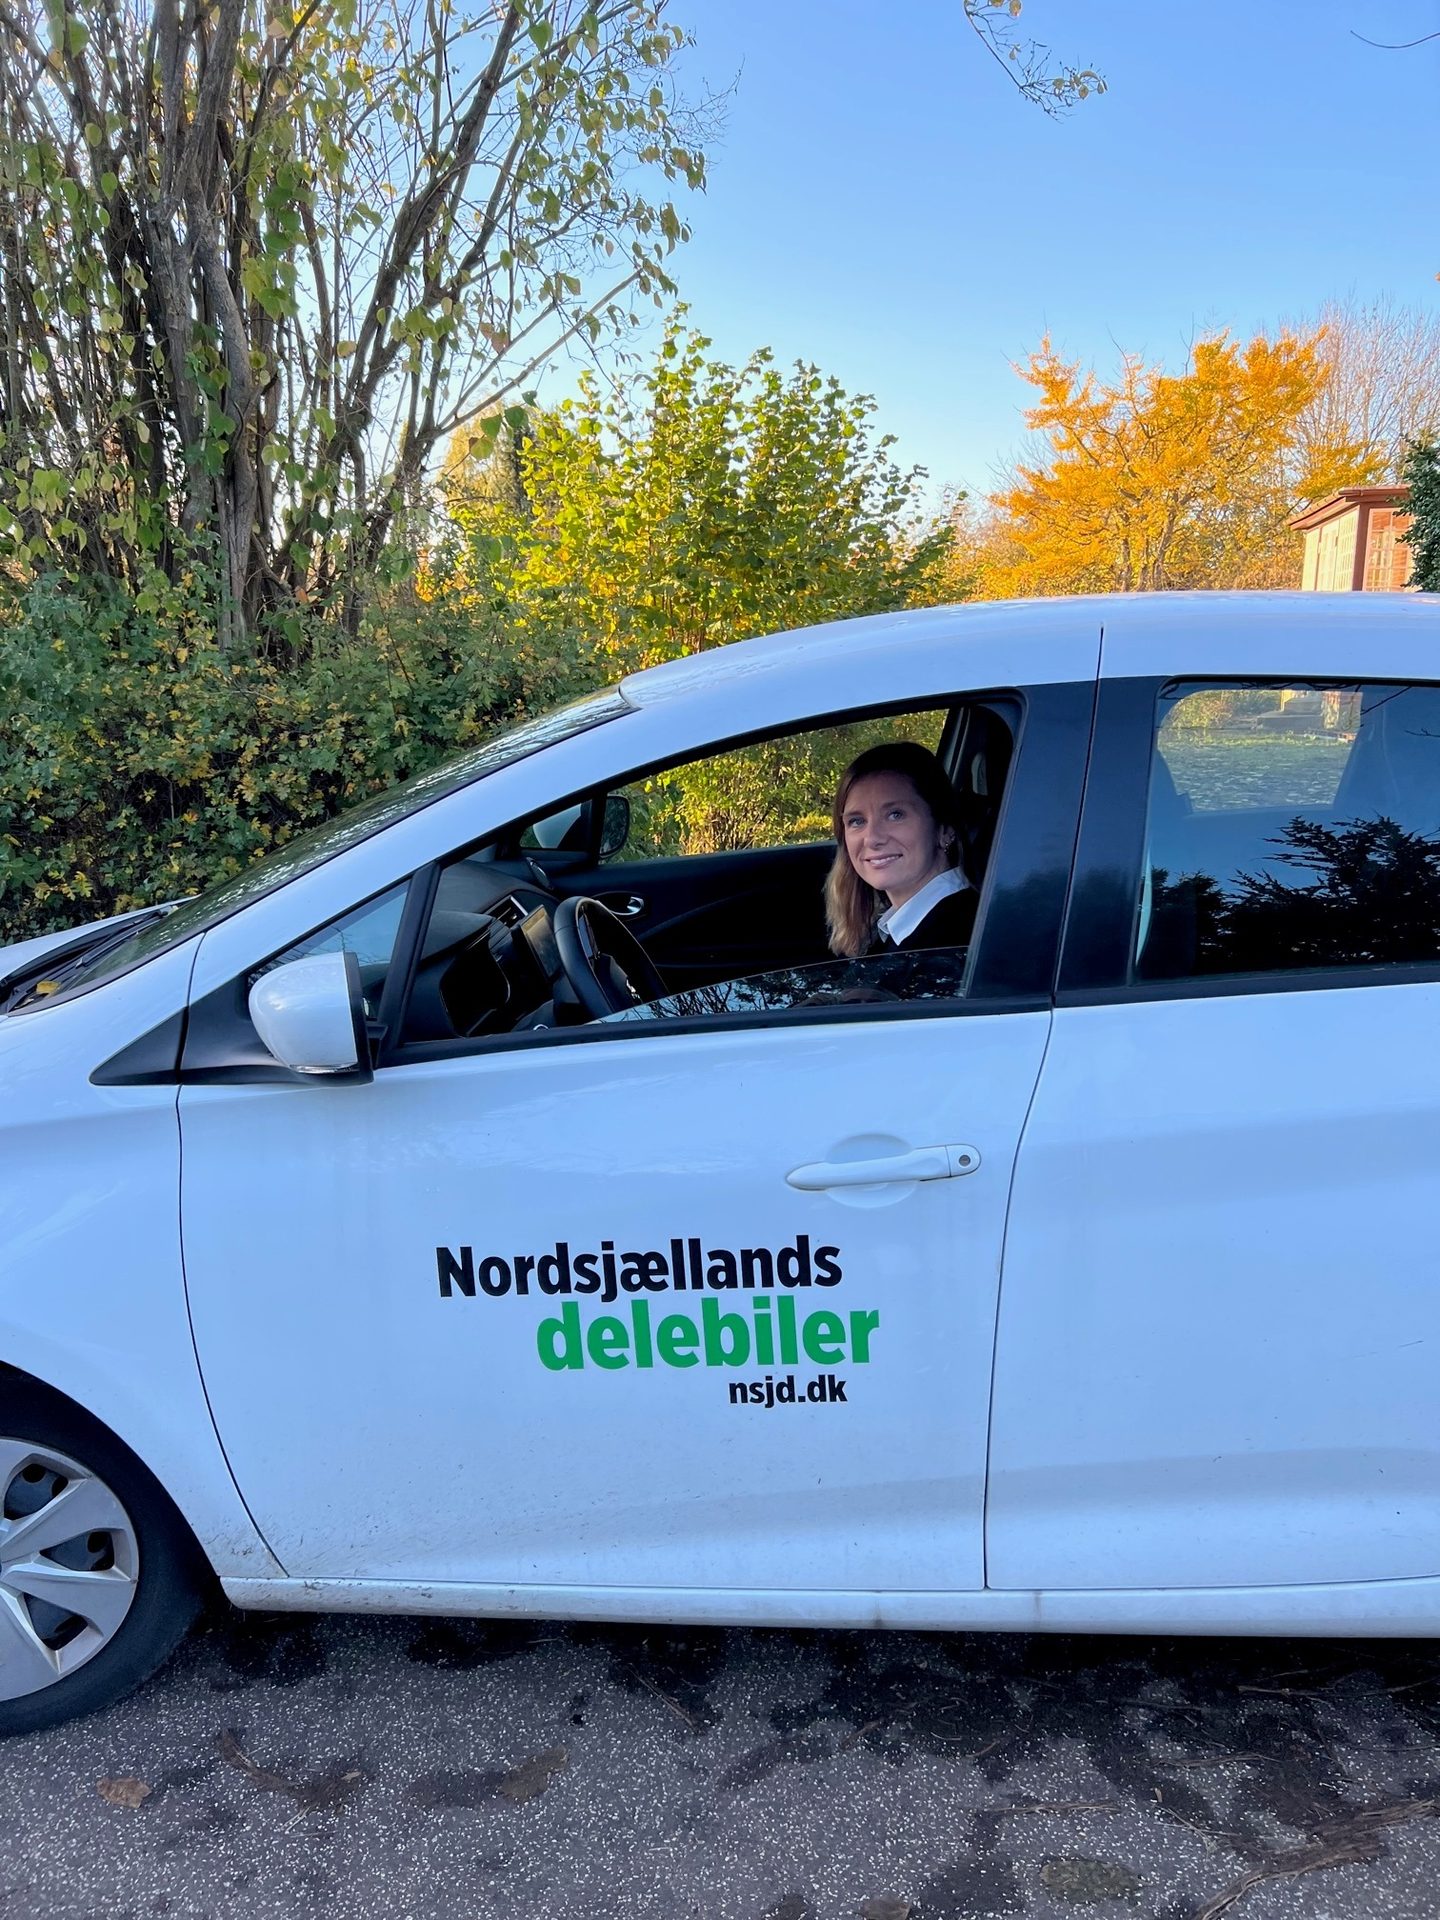
Ditte Larsen from Hareskovby had bought a second car. She and her family have now sold it again in favour of a car-sharing solution. Ditte has even created a local car-sharing association in her area.    

Growing climate awareness prompted Ditte Larsen to contact Nordsjællands Delebiler (North Zealand Car-sharing Association) in the autumn of 2022. A successful meeting ended with Ditte Larsen taking the initiative to establish a local association branch in Hareskovby.  

“We are five families in Hareskovby who have ditched a second car in favour of sharing a car. It is very satisfying to think that we have contributed to the environment by reducing the number of cars and, at the same time, we are saving money. 

If you ask Ditte Larsen if it’s a bit of a hassle to use a car-share instead of her car in the driveway, she is quick to respond:  

“Actually, I think it’s easy. We have a car within one kilometre, but having said that, even if it were slightly inconvenient, we can’t expect to reduce emissions and resource consumption by always choosing the easiest option.” 

Motor vehicle, Automotive lighting, Wheel, Tire, Car, Window, Sky, Hood

CASE

Photo: Preben Bitsch

READ MORE

3

Energy renovations in municipalities slowed down by construction cap

3

Leaky municipal buildings lose heat

543.600 tonnes

This is the amount by which CO2 emissions could be reduced by 2030.

Read more +

Many municipally owned buildings are losing heat. They are old and leaky. However, municipalities rarely carry out energy renovations and, consequently, lose the opportunity for significant CO2 savings. The reason is not a lack of ambition but the municipal construction cap.

31 million square metres. This is how much Danish municipalities own, from primary schools to town halls and nursing homes9. As Denmark’s largest real estate owners, it would therefore seem natural that municipalities also lead the way in energy renovation, but that is far from the reality. This is because of the municipal construction cap.

In its current form, the construction cap is an exasperating and unnecessary barrier to sound investments and green transition.

Katrine Bjerre Milling Eriksen, director of Synergi.

Municipalities cannot choose how much money they want to spend on maintaining their buildings. As the name suggests, the construction cap limits how much money municipalities can spend on maintaining their facilities, for example. This restriction can have very real consequences, such as loose tiles, peeling facade paint and poor indoor air quality.

However, it also affects the climate accounts. The construction cap is not a cap on CO2 emissions - quite the opposite. This is because the cap limits how much municipalities can spend on energy-renovating their buildings.

A considerable number of them need energy renovations. Many are over 50 years old, have flimsy insulation and leaky windows - and some are heated by oil or gas boilers10. Consequently, they use much more energy and cost more in CO2 than necessary. CO2 savings can be made by investing municipal money in the energy renovation of municipal square metres.

Energy labelling of municipal buildings

Energy and consequently CO2 and money could be saved if more municipal buildings were renovated to improve their energy labelling to at least a C rating. Currently, about two-thirds of municipal buildings’ energy rating is below C11.

Deloitte Economics

543.600 tonnes

This is the amount by which CO2 emissions could be reduced by 2030.

A great deal of energy and, subsequently, CO2 and money could be saved if more municipal buildings were renovated to raise their energy rating to at least C. Calculations by Deloitte Economics show that improving the energy rating of the 68% of municipal buildings below energy label C, would save an average of 77,657 tonnes of CO2 a year, or 543,600 tonnes of CO2 by 2030. In CO2 equivalents this corresponds to the yearly carbon footprint of approximately 72,000 Danes (Source: Statistics Denmark).

This is what we did

What impact would it have on Danish municipalities if the building budget is raised so more capital can be set aside to boost the energy efficiency in municipal buildings by way of renovation projects? The estimates for these barriers are based on a study by Transition.nu (2021).

Starting point:

• 68% of municipal buildings have an energy rating of D or below.

• Municipal buildings’ current energy consumption is 3.1 TWh per year, corresponding to annual greenhouse gas emissions of 361 kilotonnes CO2-equivalent.

Assumed intervention:

• Investment in implementing improvements (e.g. insulation, solar shading, ventilation systems, etc.) to substantially upgrade municipal buildings’ energy performance.

• The renovations are estimated to take place over a three-year period (the full benefits of renovation will be realised in year 3).

Estimated effect:

• 20% of municipal buildings have an energy rating of D or below.

• The modifications and renovations implemented on the upgraded buildings translate into energy savings of 734 GWh annually and the reduction of greenhouse gas emissions by 90.6 kilotonnes annually.

Limitations:

• We use the most effective of the two scenarios proposed by Transition.nu. A scenario that only focuses on “profitable” retrofits (below 2020 energy prices) suggests avoiding GHG emissions of 79.1 kilotonnes per year. The selected scenario of 90.6 kilotonnes disregards cost-effectiveness estimates.

• The work undertaken by Transition.nu, on which our results are based, rests on an analysis of 6,418 municipal energy labelled buildings extrapolated to the national municipal building inventory (20,427 units).

“Energy renovation of old, dilapidated municipal buildings is good business for municipal budgets and the climate. An investment of DKK 5.6 billion12 will generate CO2 savings of 80,000 tonnes each year and reduce the municipalities’ total energy bill by DKK 800 million. This means that the payback period is just seven years - after which municipalities will have an extra DKK 800 million each year to invest in schools, elderly care, day-care centres, or other services. Unfortunately, the construction cap is an obstacle for municipalities with money in their budgets or ready to borrow money for energy renovations. In its current form, the construction cap is an exasperating and unnecessary barrier to sound investments and the green transition,” says Katrine Bjerre Milling Eriksen, CEO of Synergi.

Deloitte Economics

543.600 tonnes

This is the amount by which CO2 emissions could be reduced by 2030.

A great deal of energy and, subsequently, CO2 and money could be saved if more municipal buildings were renovated to raise their energy rating to at least C. Calculations by Deloitte Economics show that improving the energy rating of the 68% of municipal buildings below energy label C, would save an average of 77,657 tonnes of CO2 a year, or 543,600 tonnes of CO2 by 2030. In CO2 equivalents this corresponds to the yearly carbon footprint of approximately 72,000 Danes (Source: Statistics Denmark).

This is what we did

What impact would it have on Danish municipalities if the building budget is raised so more capital can be set aside to boost the energy efficiency in municipal buildings by way of renovation projects? The estimates for these barriers are based on a study by Transition.nu (2021).

Starting point:

• 68% of municipal buildings have an energy rating of D or below.

• Municipal buildings’ current energy consumption is 3.1 TWh per year, corresponding to annual greenhouse gas emissions of 361 kilotonnes CO2-equivalent.

Assumed intervention:

• Investment in implementing improvements (e.g. insulation, solar shading, ventilation systems, etc.) to substantially upgrade municipal buildings’ energy performance.

• The renovations are estimated to take place over a three-year period (the full benefits of renovation will be realised in year 3).

Estimated effect:

• 20% of municipal buildings have an energy rating of D or below.

• The modifications and renovations implemented on the upgraded buildings translate into energy savings of 734 GWh annually and the reduction of greenhouse gas emissions by 90.6 kilotonnes annually.

Limitations:

• We use the most effective of the two scenarios proposed by Transition.nu. A scenario that only focuses on “profitable” retrofits (below 2020 energy prices) suggests avoiding GHG emissions of 79.1 kilotonnes per year. The selected scenario of 90.6 kilotonnes disregards cost-effectiveness estimates.

• The work undertaken by Transition.nu, on which our results are based, rests on an analysis of 6,418 municipal energy labelled buildings extrapolated to the national municipal building inventory (20,427 units).

Heat is leaking out of the school

Bjørn Johansen is chairman of the board of the Søren Kanne school in Norddjurs Municipality. He had been looking forward to renovating the school with new windows and doors, reducing energy bills and CO2 consumption, and creating a healthier indoor climate for teachers and pupils. However, the construction cap prevents the municipality from spending DKK 12 million, which was earmarked for the purpose. Part of the money has been set aside in the hope that the municipality will be permitted to spend the money in 2023. However, this is still being determined. Meanwhile, heat still seeps out of the old school buildings while the school board awaits the green light.

“I fear the much-needed renovations will not happen for a long time. The heat is leaking out and, besides an unnecessarily high heating bill, students and teachers must spend many hours in cold and draughty conditions. It’s not good for the climate either,” says Bjørn Johansen.

CASE

READ MORE

4

Labour shortage

4

You know how it is. You’ve been dreaming of a new patio or deck. You’ve saved up for it. The materials have been purchased. But the carpenter? The earliest he can begin the work is sometime in November. The situation is the same for the green transition.

Ambition is not in short supply when it comes to the green transition. But there is a shortage of labour. More precisely, 25,000 people per year or around 200,000 people towards 2030. That is almost the same number of people who live in Odense Municipality. We are talking about people with IT skills and other specialists. Skilled workers, in particular, are in short supply.

Over the next few years, as oil and natural gas boilers are replaced, wind turbines are built, and energy islands are constructed, there will be a shortage of around 100,000 skilled workers. In addition to workers, there will also be a shortage of specialised short, medium and long-term higher-educated staff - especially IT experts who can develop the energy efficiency algorithms of the future.

The green transition lacks heads and hands

Many more hands are needed to build energy islands and wind turbines at the pace required to meet our 2030 climate goals.

A Danish Trade Union Confederation study found that investing in the green transition would create more than 200,000 additional jobs towards 203013. The problem is just that there need to be more people to fill them.

The labour shortage is so critical that unions and organisations over a broad spectrum are calling for action in three areas: Education, retention and attracting foreign workers. And it cannot happen fast enough:

“As things stand now, there will be a severe shortage of skilled workers by 2030. That is even before we factor in the green transition, which will increase demand further. The green transition has been a golden opportunity for Denmark in the past. For instance, it could be the same again as it was with the wind turbines. However, we must educate and train more skilled workers, including young people, throughout the education system. This is a crucial factor in achieving the climate goals and creating the best terms for the Danish economy,” says Sofie Holme Andersen, Chief Economist at the Economic Council of the Labour Movement.

Heat pumps on standby

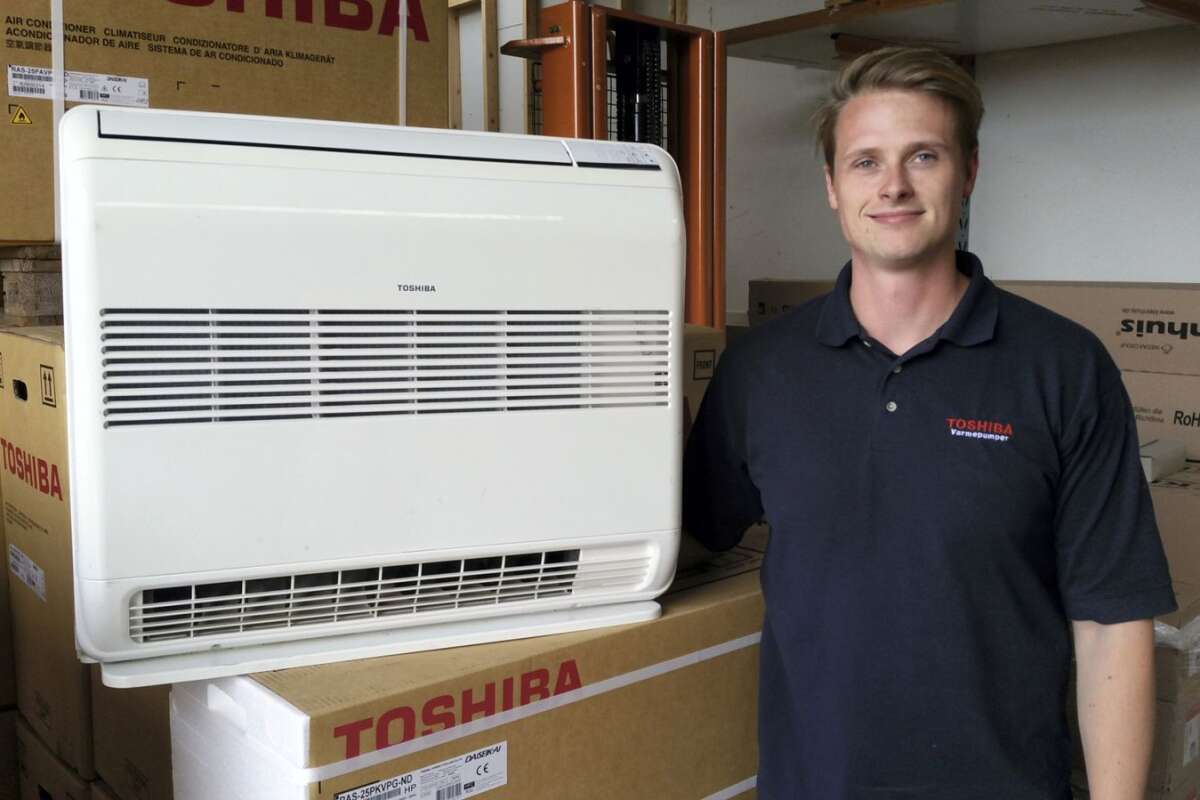
Gidex in Kjellerup in central Jutland installs heat pumps. The owner, Kasper Andersen, has ensured plenty of heat pumps are in stock - because demand has steadily increased since the energy crisis hit. During the autumn of 2022, he and his staff reacted exceptionally swiftly. Meanwhile, Kasper struggled to attract qualified labour for the growing order book.

“We have a huge order book to sort out and currently have a waiting time of 2 to 3 months. If another bubble occurs where people want heat pumps, we will have a massive problem. It isn't proving easy to get qualified labour, so we’re actively recruiting through our various networks and posting jobs on all the relevant forums. The people we need most are qualified plumbers and electricians. Not enough of these skilled workers are being trained, and there is a huge demand for them,” says Kasper Andersen.

Smile, Sleeve

CASE

READ MORE

5

Tax regulations hinder reclaiming of lowland soil

5

It should be obvious. Stop growing crops in areas of lowland soil and install solar cells instead. The CO2 benefits are potentially huge, yet tax regulations get in the way.

Lowland soil. What is that? It’s a type of farmland that used to be, for example, wetlands. It’s also a type of soil that contains particularly high levels of carbon. Carbon-rich lowland soils account for more than 50% of total emissions from cultivating the land, even though they comprise only 7% of the agricultural land in Denmark14.

Somebody needs to do something, you might think. You would be right – and not alone. In Denmark, agriculture is responsible for a third of the country’s greenhouse gases emitted into the atmosphere. Agriculture could take a giant step towards reducing emissions by ending the cultivation of crops on lowland soils.

It would be particularly beneficial to install solar cells on the land instead of cultivating crops.

If we are to achieve our climate goals, a significant expansion of renewable energy will be required.

Peter Bjerregaard, Market Regulation Manager at Better Energy.

And herein lies the problem.

If a farmer chooses to ditch crops and opt for solar cells instead, the tax on the land increases as much as ninefold. More specifically, this is because the land goes from farmland to industrial land. This type of land is taxed more - and at the same time, the resale value is often less.

Although you could get more green energy for less CO2 by converting these farmlands, there is no single solar cell on Denmark's 170,000 hectares of lowland soil.

“If we are to achieve our climate goals, a significant expansion in renewable energy will be required. If we simultaneously install solar farms on carbon-rich lowlands, which can be removed from agricultural use and rewetted, we can kill two birds with one stone. Unfortunately, tax regulations are holding back development,” explains Peter Bjerregaard, market regulation manager at the energy company Better Energy.

Heavy taxation on converting low-quality farmland to solar farms

5.104.350 tonnes

This is the amount by which CO2 emissions could be reduced by 2030.

More about lowland soils
Lowland soils are or were wetlands, such as meadows and bogs, with rich carbon concentrations. When lowland soils are left undisturbed, the carbon remains in the soil, but when lowland soils are drained and cultivated as farmland, the carbon is released into the atmosphere. Reclaiming lowland soil reduces CO2 emissions by cutting off drains and filling ditches. This restores the natural water level of the land.
In 2020, Denmark's total cultivated lowland area was estimated to be just over 170,000 ha. In 2018, carbon-rich lowland soils emitted about 4.8 million tonnes of CO2e, corresponding to 70% of Denmark’s total passenger car fleet (15).

Read more +

Deloitte Economics

5.104.350 tonnes

This is the amount by which CO2 emissions could be reduced by 2030.

According to calculations by Deloitte Economics, if 50% of the lowland soils were drained and converted to grassland by 2030, the CO2 gain would be 6,335,5505,104,350 tonnes of CO2. This represents well over a quarter of the way to reaching Denmark’s 70% target by 2030.

This is what we did

What would be the result if half of the Danish peatland used to grow crops were turned into grassland?

Starting point:

• 171,000 ha of peatland is cultivated in Denmark (The Danish Society for Nature Conservation, 2022)

Assumed intervention:

• 50% of the peatland will be converted to grassland (i.e. no more cultivation). This is a government target. Complete land conversion is progressive over a period of three years.

Estimated effect:

• Grassland areas do not stop emitting greenhouse gases, but their emissions are much lower than cultivated land. According to information from The Danish Centre for Food and Agriculture (2020), emission factors from IPCC find that grassland emits 10.0 tonnes of CO2-equivalent Ha per year less than cultivated land (a 27% decrease).

• We assume an equal mix of land with a carbon content of >12% and land with a carbon content between 6% and 12% (two standard international classifications).

• We assume perennial grass is grown for grassland, while cultivated land is considered under rotation.

Limitations:

• Measuring GHG emissions from land depends on atmospheric considerations and broader considerations related to the local ecosystems. Accurate measurements vary from year to year and are subject to some uncertainty.

The first solar cells in the bog

Although the road to lowland reclamation is burdened with high taxes, there are success stories to tell.

One is from Vordingborg, where Denmark’s first solar farm built on lowland soil is under construction. Here, 156 hectares of lowland soil in Køng Mose will be reclaimed and replaced with a solar farm that will produce electricity for around 42,000 households. Landowners, an energy company and the Minister of Agriculture are enthusiastic about the pioneering project, and the Minister is interested in checking the tax regulations in greater detail16.

CASE

READ MORE

6

Electronics consumption increases while resources dwindle

6

A new smartphone. A new computer. A new TV. Throw out, repeat. The consumption of electronics is booming. Unfortunately, the same cannot be said for recycling the precious raw materials contained in electronics, which are needed to create green technologies for a green transition. Gains can be made on the climate account by increasing recycling and reducing consumption.

In 2020, Denmark won the Euros. Not in football but in buying electronics17. Unfortunately, in 2022 we will not be able to boast a similar European top position regarding recycling the many electronics we buy. In this respect, Denmark is down to 20th place in the EU18 because we only collect a little more than 50% of our electronics for recycling.

According to many experts, the growing pile of e-waste, old smartphones in the desk drawer and TVs in the attic is a real climate problem. Indeed, many of the precious raw materials in electronics (rare earth elements such as cobalt and lithium) are critical in developing the green technologies we need in the green transition - for example, for car batteries, microchips and solar panels19 20. As the table below shows, by 2035, we’ll have an obvious problem getting enough of them if we continue with the status quo.

Electronic products impact our environment. Most of all, in production in terms of product lifetime and disposal. Once the precious metals and other limited resources have been extracted for production, it is essential to ensure that they are part of a circular flow, where the focus is primarily on reuse and life extension and then on recycling the materials that comprise the particular product,” says Thomas Billesø Jensen, Strategic Account Manager, Stena Recycling. 

The “good” news is that Danes are not the only ones contributing to the growing pile of e-waste that is not recycled. According to The Global E-Waste Monitor 2020, the amount of e-waste globally has increased by 21 per cent in just five years21.

When precious metals and other limited resources are extracted for production, it is important to ensure that they are part of a circular flow.

Thomas Billesø Jensen, Strategic Account Manager, Stena Recycling

To tackle the problem and ensure better recycling of the precious resources hidden in e-waste dumps, the European Commission will propose new legislation on critical raw materials in the first quarter of 2023. Among other things, the legislation will help to increase the recycling of raw materials and increase production within the EU. Recycling could fully meet the EU’s needs for rare earth elements by 2050 and cover 45-77% of the demand for metals used in batteries by 205022. But the prerequisite for being able to recycle is to collect our electronic waste in the first place. If we get better at this - and there is room for improvement - the global climate gains will be substantial. Read more in the box on the right.

Should we introduce a deposit scheme for electronics?

4.965.682 tonnes

This is the amount by which CO2 emissions could be reduced by 2030.

We’re running out of batteries

For instance, the demand in Europe for critical raw materials for producing batteries and wind turbines is rising. By 2035, it will far exceed the supply unless we get better at extracting and recycling rare earth elements. Source: Think Tank Europe, 2022

Read more +

Deloitte Economics

4.965.682 ton

Så meget CO2 vil kunne spares frem mod 2030.

Ifølge beregninger fra Deloitte Economics, så vil der være globale klimagevinster at hente, ved at øge genanvendelse af e-affald, samt generelt skrue op for cirkulært forbrug.

Øget genanvendelse af e-affald

Hvis vi i Danmark øger mængden af genanvendt e-affald med 25%, vil den årlige CO2-gevinst gennemsnitligt være 58.591 tons CO2. Det svarer til 410.140 tons CO2 sparet frem mod 2030.

Øget cirkulært forbrug

Hvis nogle af de mest klimabevidste forbrugere skiftede til cirkulært forbrug i 50% af deres budget, ville den årlige CO2-gevinst være 650.792 tons CO2 eller 4.555.542 tons CO2 frem mod 2030

For begge disse tal er det ikke muligt at betragte CO2-besparelsen i forhold til vores nationale klimamål. Det skyldes at produktionen af mange af de produkter, der er tale om, og dermed også CO2-udledningen, sker i andre lande end i Danmark. Derfor taler vi her om globale klimagevinster.

Sådan er beregningen lavet

Øget genanvendelse af e-affald

Hvad ville være den globale effekt af at indsamle og genbruge 50 % mere af Danmarks elektroniske affaldsprodukter?

Udgangssituation:

179 kilotons affaldselektronik hvert år (United Nations University / United Nations Institute for Training and Research, 2020)

Den nuværende indsamlingsprocent for elektronisk affald er 44 % (United Nations University / United Nations Institute for Training and Research, 2020)

Den nuværende genanvendelsesprocent for elektronisk affald er 82 % (af indsamlet affald, Eurostat), det vil sige 64,8 kilotons

Antaget indgreb:

Uafhentet elektronikaffald indsamles og genanvendes med den aktuelle genanvendelsesprocent for hver geografi

50 % af det nygenanvendte affald gennemgår en optimeret genbrugsproces, hvor transportveje er optimeret, og hvor der anvendes højkvalitets materialegenvindingsmetoder.

Formodet effekt:

Effekten af optimeret genanvendelse antages at være 2,01 kg undgået drivhusgasemission pr. kg affald af elektronisk udstyr (Bond, 202, under et projekt finansieret af European Regional Development Fund)

Elektronisk affald (og relateret genbrug) antages at vokse med 1,4 % hvert år, baseret på den historiske vækstrate for enheder, der markedsføres (United Nations University / United Nations Institute for Training and Research, 2020)

Begrænsninger:

Metoden til estimat af affald er baseret på en "placed on market"-tilgang (POM). POM-tilgangen estimerer affaldsgenerering baseret på mængden af solgte enheder i en given geografi og giver typisk højere estimater end andre statistiske estimater af elektronisk affald.

Virkningen af den nuværende genbrugsmetode er svingende og er svær at vurdere konsekvent. Af denne grund fokuserer vores vurdering kun på uafhentet affald, der gennemgår genanvendelse af høj kvalitet for at undgå at lave antagelser om genanvendelsesprocenterne for de nuværende genanvendelsesmetoder.

CO 2 -besparelsesforudsætningerne for optimeret genanvendelse (2,01 kg pr. kg affald) er taget fra Bond, 2022 under et projekt af European Regional Development Fund. Forskningen er en kombineret tilgang af materialestrømsanalyse og livscyklusvurdering. Disse resultater er sandsynligvis undervurderet for genanvendelse af høj kvalitet: Resultater fra en livscyklusvurdering udført af Deloitte på kritisk materialegenvinding fra elektronisk affald tyder på en 2,04 kg/kg pr. kg affaldspåvirkning på undgåede emissioner.

De 50 % af affaldet, der går gennem optimeret genanvendelse, er en vilkårlig antagelse, som er en del af hypoteseudviklingen og er ikke understøttet af forskning.

Øget cirkulært forbrug

What would be the impact of increasing the circularity of consumer goods (i.e. repairing damaged goods or buying goods second-hand rather than purchasing brand new items or replacing items when they break)?

Baseline situation:

Consumption-based GHG emissions are 7.3 tonnes per capita per year (Global Carbon Project 2022, 2019 base year).

Yearly aggregate consumption is EUR 24,410 per capita (Eurostat, 2019 base year).

Consumption-based GHG decreases by 1.9% yearly.

Assumed intervention:

A range of policy measures are implemented to incentivise the switch to circularity (e.g. a reduced VAT rate on repair services and second-hand goods).

A share of the Nordic population is assumed to be “eco-active” and take active steps to take climate considerations into account in its consumption patterns (e.g. buying more sustainable products, actively manage waste, etc.). Eco-active consumers are assumed to switch a share of their consumption towards circularity when possible.

The share of eco-active consumers is estimated to be 21.3% in the Nordics and grows at a pace of 2.6 percentage points every year (based on European data from a 2022 GfK panel, using a median scenario).

Assumed impact:

Using the composition of Eurostat’s harmonised index of consumer prices (2022) as a proxy for consumption expenditure structuring, 9.4% of aggregate consumption is assumed to be spent on goods that are eligible to circularity (e.g. small appliances, toys, clothing items).

50% of end-of-life goods are assumed to be repairable or available as second-hand items rather than purchased from new again.

Repaired or second-hand goods translate into avoided GHG emissions from new products.

The impact is expressed net of the trending decrease in consumption-based GHG emissions observed in the baseline.

Limitations:

By using aggregate consumption data, there is an implicit assumption that the CO2 intensity is smoothed across the different items making the average consumer basket. This is a simplification due to data constraints that limits the precision of the analysis. It should however yield a more conservative impact assessment since manufactured goods on which repairs services can be performed are typically more CO2 intensive than other items in the average consumption basket (e.g. services).

Nordic households typically demonstrate more eco-friendly consumption patterns than in most other European countries. The fraction of eco-friendly consumers in the Nordics is therefore likely to be underestimated.

When comparing the impact of repair services or second-hand purchases to the impact of material recovery (through recycling), it should be noted that the majority of GHG emissions for manufactured goods stem from manufacturing processes rather than from raw materials (hence the much larger impact of repair and reuse per product).

The 50% switch to circularity is an arbitrary assumption made as part of hypothesis-development and is not backed by research.

Deloitte Economics

4.965.682 ton

This is the amount by which CO2 emissions could be reduced by 2030.

According to calculations by Deloitte Economics, global climate gains can be made by increasing e-waste recycling and generally increasing circular consumption.

Increasing e-waste recycling

If we increase the amount of e-waste recycling in Denmark by 25%, the annual CO2 gain would be 36,833 tonnes of CO2. This corresponds to 257,833 tonnes of CO2 saved towards 2030.

Increased circular consumption

If all consumers switched to circular consumption in 50% of their budget, the annual CO2 gain would be 667,679 tonnes of CO2 or 4,417,411 tonnes of CO2 by 2030

It is impossible to consider the CO2 savings for both these figures in relation to our national climate. This is because the production of many of the products in question, and therefore the CO2 emissions, take place in countries other than Denmark. That is why we are talking about global climate gains.

This is what we did

What would be the global impact of collecting and recycling 50% more of Denmark’s electronic waste products?

Starting point:

• 179 kilotonnes of electronic waste each year (United Nations University / United Nations Institute for Training and Research, 2020)

• The current collection rate for electronic waste is 44% (United Nations University / United Nations Institute for Training and Research, 2020)

• The current recycling rate for electronic waste is 82% (of waste collected, Eurostat), i.e. 64.8 kilotonnes.

Assumed intervention:

• Uncollected electronic waste is collected and recycled at the current recycling rate for each geography.

• 50% of the newly recycled waste undergoes an optimised recycling process, where transport routes are optimised, and high-quality material recovery methods are used.

Estimated effect:

• The effect of optimised recycling is estimated to be 2.01 kg of greenhouse gas emissions saved per kg of electronic waste (Bond, 202, during a project funded by the European Regional Development Fund).

• Electronic waste (and related recycling) is projected to grow by 1.4% each year, based on the historical growth rate of devices that are marketed (United Nations University / United Nations Institute for Training and Research, 2020)

Limitations:

• The waste estimation methodology is based on a ‘placed on market’ (POM) approach. The POM approach estimates waste generation based on the volume of units sold in a given geography and typically provides higher estimates than other statistical estimates of electronic waste.

• The impact of the current recycling approach is variable and difficult to assess consistently. Therefore, our assessment focuses only on the uncollected waste that undergoes high-quality recycling to avoid making assumptions about recycling rates for current recycling methods.

• CO2 saving estimates for optimised recycling (2.01 kg per kg waste) are based on Bond, 2022, a European Regional Development Fund project. The research is a combined approach of material flow analysis and life cycle assessment. These results probably underestimate the high-quality recycling: Results from a life cycle assessment conducted by Deloitte on critical material recovery from electronic waste suggest a 2.04 kg/kg per kg waste impact on prevented emissions.

• The 50% of the waste that goes through optimised recycling is an arbitrary assumption which is part of the hypothesis development and not backed by research.

7

Food waste

7

We Danes love food! But we also love to throw food away. And that has consequences; for personal finances, especially when it comes to the CO2 footprint. Globally, food waste is as significant a burden as the entire transport sector. We will only meet our climate goals if we tackle food waste.

Every year, we Danes throw away just over 1,200 tonnes of food. The food waste in Denmark each year is equivalent to 9.5% of the total CO2 emissions in Denmark. So, it is safe to say that food waste is a significant climate burden. Producing food is so CO2-heavy that it amounts to the same as the global emissions from the world’s transport sector.

Clearly, food waste is a global problem. By 2050, there will be 9 billion people on the planet. That means we cannot continue wasting food at the current rate, where one-third of all the world’s food goes to waste if we are to have any chance of reaching our climate goals and feeding the world’s population in the future23.

The fact that the fight against food waste is shouldered mainly by volunteers and well-meaning citizens is unsustainable.

Selina Juul, founder and chair of Stop Spild af Mad (Stop Wasting Food).

So, what is the solution, then? Of course, it’s down to the individual household. More leftover food. Less sell-by-date hysteria. But experts point out that food waste is a systemic problem that can be attributed to every stage of the food chain, from production, processing and packaging to distribution, retail and consumption.

“It is not sustainable that the fight against food waste is mainly carried on the shoulders of volunteers and well-meaning citizens. Voluntary organisations cannot be expected to work weekdays and public holidays to solve the major societal problem of food waste and, in addition, to pay for the operation and costs out of their own pockets. If the battle against food waste is reliant primarily on volunteers and well-meaning Danes, there is a risk that it will peter out entirely in the long run,” stresses Selina Juul, founder and chair of Stop Spild Af Mad [Stop Food Waste], Sjællandske Medier, 2022.  

Climate goals go into the bin

6.299.981 tonnes

This is the amount by which CO2 emissions could be reduced by 2030.

Read more +

Deloitte Economics

6.299.981 tonnes

This is the amount by which CO2 emissions could be reduced by 2030.

Reducing food waste means full bellies, a more robust economy - and a better climate. Calculations by Deloitte Economics indicate that if we reduce food waste by 50% by 2030, we could remove a total of 6,299,981 tonnes of CO2 from the atmosphere.

This is what we did

What would be the global impact of reducing Denmark’s annual food waste by 50% before 2030 (on a 2020 baseline)

Starting point:

• 1,286 kilotonnes of food were wasted in Denmark in 2020 (Eurostat, 2022, 2020 data).

• Consumption-based greenhouse gas emissions decrease by 1.9% annually in Denmark

• Food waste is considered across the entire value chain, including primary production, processing and manufacturing, retail and distribution, restaurants and food service, as well as households.

Assumed intervention:

• Policies and incentives allow a gradual decrease in food waste to reach 50% of the 2020 baseline in 2030 (linear progression).

Estimated effect:

• The eliminated food waste is assumed to be consumed, thereby displacing the need for food production and the GHG emissions associated with the production of that food.

• Food waste is divided into three categories (animal, vegetable and mixed) according to the European Waste Catalogue for Statistics (EWC-Stat), using a series of coefficients to adjust for a fraction of materials unfit for human consumption contained in these waste streams (Caldeira ). et al., 2022).

For each food waste category, an average CO2-equivalent content is estimated using Concito’s “Large Climate Database”. The following CO2 intensity factors are adopted:

• 4.26 kg CO2-e Kg animal food waste.

• 1.33 kg CO2-e per kg vegetable food waste

• 2.80 kg CO2-e per kg mixed food waste (assumed to be a mixture of vegetable and animal).

• The decrease in GHG emissions is included after deducting the trending consumption-related decreases (observed during 2015-2019 as reported by the Global Carbon Project and is considered part of the baseline).

Limitations:

• Food waste is known to be difficult to estimate reliably (e.g. see the work of the World Food Programme), especially from a value chain point of view. The approach is imperfect but is based on the most recent data and research available on the subject.

• Alternative waste estimates using material flow analysis provided by Caldeira et al. (2022) show comparable results to the estimates from the approach that is used here for Denmark (the only Nordic country included in the research).

A total of

tonnes.

Primary production: 66.452 tons

Retail and wholesale: 99.500 tons

Households: 461.392 tons

Food industry: 596.599 tons

Catering industry: 62.544 tons

Breakdown of food waste

Estimation of food waste in tonnes per year, data from the Danish EPA 2021.           

Deloitte Economics

6.299.981 tonnes

This is the amount by which CO2 emissions could be reduced by 2030.

Reducing food waste means full bellies, a more robust economy - and a better climate. Calculations by Deloitte Economics indicate that if we reduce food waste by 50% by 2030, we could remove a total of 6,299,981 tonnes of CO2 from the atmosphere.

This is what we did

What would be the global impact of reducing Denmark’s annual food waste by 50% before 2030 (on a 2020 baseline)

Starting point:

• 1,286 kilotonnes of food were wasted in Denmark in 2020 (Eurostat, 2022, 2020 data).

• Consumption-based greenhouse gas emissions decrease by 1.9% annually in Denmark

• Food waste is considered across the entire value chain, including primary production, processing and manufacturing, retail and distribution, restaurants and food service, as well as households.

Assumed intervention:

• Policies and incentives allow a gradual decrease in food waste to reach 50% of the 2020 baseline in 2030 (linear progression).

Estimated effect:

• The eliminated food waste is assumed to be consumed, thereby displacing the need for food production and the GHG emissions associated with the production of that food.

• Food waste is divided into three categories (animal, vegetable and mixed) according to the European Waste Catalogue for Statistics (EWC-Stat), using a series of coefficients to adjust for a fraction of materials unfit for human consumption contained in these waste streams (Caldeira ). et al., 2022).

For each food waste category, an average CO2-equivalent content is estimated using Concito’s “Large Climate Database”. The following CO2 intensity factors are adopted:

• 4.26 kg CO2-e Kg animal food waste.

• 1.33 kg CO2-e per kg vegetable food waste

• 2.80 kg CO2-e per kg mixed food waste (assumed to be a mixture of vegetable and animal).

• The decrease in GHG emissions is included after deducting the trending consumption-related decreases (observed during 2015-2019 as reported by the Global Carbon Project and is considered part of the baseline).

Limitations:

• Food waste is known to be difficult to estimate reliably (e.g. see the work of the World Food Programme), especially from a value chain point of view. The approach is imperfect but is based on the most recent data and research available on the subject.

• Alternative waste estimates using material flow analysis provided by Caldeira et al. (2022) show comparable results to the estimates from the approach that is used here for Denmark (the only Nordic country included in the research).

Overskudsvarer til de mest udsatte

Salling Group har en ambition om at gøre madspild til måltider. Derfor har de siden 2016 lagt deres madspildsdata frem for offentligheden. Virksomheden samarbejder med blandt andet Stop Spild Lokalt, der sørger for, at udsatte borgere får glæde af overskudsvarerne og FødevareBanken, der leverer overskudsmad til sociale institutioner og væresteder.

Allerede nu henter FødevareBanken overskudsmad fra Salling Groups distributionscentre, men med et nyt partnerskab vil det hæve ambitionen og sikre, at også udvalgte butikkers madspild bliver doneret til socialt udsatte og samtidig skabe en øget opmærksomhed på madspild blandt forbrugerne.

”I Salling Group arbejder vi målrettet på, at mest muligt mad ender på tallerkenen, og vi har allerede nået store milepæle mod vores mål om en halvering af vores samlede madspild inden 2030. FødevareBanken deler vores ambition om, at mindre mad skal gå til spilde, og her er det nye, strategiske partnerskab vigtigt for os, så vi når vores mål”, udtaler Henrik Vinther Olesen, CSR- og kommunikationsdirektør i Salling Group, Ritzau, 2022.

Vision care, Dress shirt, Forehead, Face, Glasses, Smile, Sleeve, Gesture, Collar, Happy

CASE

LÆS HELA CASEN

8

Political wavering delays the green transition

8

Companies developing green technologies are on the verge of rolling out their technology. However, something is slowing them down. Unclear rules and frameworks mean that no one dares to go all in.

Malicious tongues will say that the road to fulfilling Denmark’s 2030 climate target is paved with hockey sticks and grand promises. Achieving the ambitious goals requires new technology that helps reduce CO2 emissions. We already know and use some of these technologies, such as heat pumps, solar cells and electric cars. Others, such as Carbon Capture & Storage (CCS), are less known and less used to combat climate change.

However, according to both the UN Intergovernmental Panel (IPCC) and the Danish Council on Climate Change (DCCC), CCS is vital if we are to meet our climate goals, both globally and nationally25. According to the government’s climate programme for 2022, the technical reduction potential for CCS is estimated to be between 3.2 and 8.3 million tonnes of CO2 by 203026.

That’s all well and good. The hockey stick is ready and just waiting to be swung.

That’s almost right. The good news is that the industry is gearing up to deploy the technologies substantially. The bad news is that the regulatory framework to do so is not really in place27. In brief: What are the rules? What support will be available? What are we permitted to do? What are we required to do?


The Carbon Capture Cluster Copenhagen (C4) partnership also stresses that CCS needs more clarity on the framework requirements and infrastructure development if the technology is to start delivering CO2 reductions. At the same time, C4 points out that swift decision-making could make CO2 reductions both bigger and cheaper29.

The entire regulatory framework for CO2 capture must be set. Meanwhile, sufficiently high CO2 taxes are required in order to support investment in CO2 capture.

Jacob H. Simonsen, director, ARC

An example is the district heating sector, which produces significant amounts of CO2 that can be stored. In particular, they are calling for legislation to build CO2 capture facilities at municipal district heating plants30. This must include a framework for how and when pipes can be installed to transport CO2 from plants to storage and to send the CO2 underground. Those rules must be in place before anyone dares to proceed. And so no one will pick up the hockey stick.

The technology is ready to deliver CO2 reductions, but framework conditions are vague at best

3.200.000 tonnes

This is how much CO2 we need to capture from the atmosphere by 2030 to meet our climate goals.

Read more +

Concito

3.200.000 tonnes

This is how much CO2 we need to capture from the atmosphere by 2030 to meet our climate goals.

CO2 capture is one of the many necessary tools that must be used to meet the new climate goals of 70% CO2 reduction by 2030, CO2 neutrality by 2045 and 110% reduction by 2050. The government expects CO2 capture to deliver at least 3.2 million tonnes of CO2 reductions already in 2030. With the new climate goals for 2045 and 2050, significantly more CO2 capture will be required by 2050. According to a recent estimate by CONCITO, 14 million tonnes of negative emissions will be needed in 2050 if we are to achieve the new 110% reduction goal28.

Sky, Building, Plant, Cloud, Tree

The green ski slope

One of the obvious places to capture CO2 is from the chimneys of municipal waste-derived energy plants. One of them is the ARC in Copenhagen. However, ARC and other waste-derived energy plants are not legally permitted to capture, store or transport CO2.

For now, funding and legal provisions have only been made available in the context of a pilot scheme. At the same time, the financial viability of CO2 capture projects must be able to add up. The forthcoming CO2 tax from the green tax reform will only apply to fossil CO2, which accounts for about one-third of ARC’s total emissions. In contrast, biogenic CO2 from organic materials is not subject to tax.

“The entire regulatory framework for CO2 capture needs to be set. At the same time, CO2 taxes must be high enough to make the investment in CO2 capture. We propose a requirement for CO2 capture at all Danish waste-derived energy plants by, for instance, 2030 and a subsidy of DKK 750 per tonne of captured and stored biogenic CO2. Otherwise, it is difficult to make a long-term investment decision”, says ARC Director Jacob H. Simonsen.

Earlier this year, ARC had to give up support from the CCS pool because it did not meet the 20% equity ratio requirements. This is partly because ARC, as a relatively new plant, still has enormous loans with extended repayment periods. The publicly owned company needs to see it as its role to amass substantial assets.

CASE

READ MORE

9

Expansion of renewable energy encounters local resistance

9

We support the green transition. As long as we don’t have to look at it, smell it, have it impact our real estate value, or...

One of the most significant barriers to the roll-out of green projects, like the construction of wind farms, is the so-called NIMBY syndrome, Not In My BackYard. Angry neighbours restrict, delay or stop green projects. Consultancies and politicians try to solve conflicts that should lead to more and better green solutions.

It’s been more than ten years since the disputes began. Back in 2011, landowners in the Gram area in southern Jutland had plans to build 46 wind turbines. Still, residents banded together and protested so vociferously that local politicians in Haderslev Municipality eventually gave in and scrapped the project in 2017. For the time being. Now the plans have been resumed. And so have the protests31.

Just like it was back in 2011, the local population is divided. Some fear that the value of their homes will decrease and that they will be exposed to the nuisance of noise and worsened views, while others can see a potential bargain in anticipation of lower electricity prices. The disagreement is so intense that it has become physical and psychological harassment.

... We have to live with the fact that wind turbines and solar cells will be seen in the landscape, but it will benefit everyone.

Jacob Klivager Vestergaard, Head of Land and Marked (Land and Market), Green Power Denmark

The case from Gram is typical. Green projects face opposition almost everywhere. Protests which, in many cases, delay, limit or stop green projects altogether. They are making it challenging to get wind turbines and solar cells on land. The energy sector trade association, Green Power Denmark, advocates for a culture change.

“With a quadrupling of onshore renewables by 2030, we have a big challenge ahead. This means that every two years, we need to have as much renewable energy up and running as we have today. This places huge demands on all of us. Therefore, we need to reinvent the way we include residents. Because we have to live with the fact that wind turbines and solar cells will be visible in the landscape, but they are there for the benefit of everyone. However, it will also be visible that this gives us the reliability of supply and lower prices,” says Jacob Klivager Vestergaard, Head of Land and Market at Green Power Denmark.

yoga pant, Active pants, Plant, Arm, Shoulder, Tree, Neck, Waist, Knee, Thigh

The installation of wind turbines and solar cells often meets local opposition from concerned citizens who fear the depreciation in property value caused by the prospect of the new installations.


… Not in my backyard

10

No plan for Denmark’s land use

10

Denmark is a great country. We are also a tiny country. And this will be a problem in the long term. A lot of green energy initiatives require space, and that is soon to be a scarce resource. Someone ought to make a plan.

Denmark is a lovely but small country. Politicians have grand ambitions for the green transition but few square kilometres on which to realise them: Four times as much energy production and far more protected nature. Then there are the other plans that will also use more or maintain areas, such as agriculture and infrastructure development.

The ambitions and plans for using Danish land are actually so substantial that if all these plans and objectives were realised, we would have to take Skåne and Blekinge back from the Swedes to have space for them all32. And unless the Minister of Defence has some sinister ulterior motives, it goes without saying that something else will need to be done.

Areas are a limited ‘raw material’ that must be used to meet a wide range of objectives. However, no political consensus exists on how this ‘raw material’ should be distributed

Tage Duer, Project Manager for Future Land Use, CONCITO.

As several experts have identified, the problem is that no one has done the land-use maths and taken a good, hard look at what should - and should not - be accommodated in Denmark33. According to the Danish Board of Technology, it will be the demands for increased energy production that will, quite literally, take up space in the landscape. Since 2017, that ambition has quadrupled politically.

Denmark’s new government aims to partner with agriculture, the food sector, nature organisations, consumer organisations and municipalities to develop a comprehensive vision plan for Danish agriculture by the end of 2023. The vision plan for Danish agriculture must also address the overall goals for land use in Denmark for agriculture, nature, and the expansion of renewable energy.

“Land is a finite ‘raw material’ that must be used to fulfil various objectives. However, there is no political consensus on how this ‘raw material’ should be distributed. The government has identified several initiatives necessary for the green transition that require space. But the initiatives will compete for space, which could get messy when implementing the plans.” says Tage Duer, Project Manager Future Land Use, CONCITO.

While visionary plans can be good, it requires a rigorous prioritisation of the available space to achieve all our ambitions. Otherwise, the green transition will halt over something as simple as a lack of space. 

“Without a comprehensive land strategy in Denmark, the green transition will be expensive for Denmark, and we risk not being able to achieve a climate-neutral and climate-resilient Denmark. If we don’t think carefully, it could be a bit of a toss-up on which agenda wins and dominates land use in Denmark in the future. This could jeopardise parts of the green transition.” Says Tage Duer, Project Manager Future Land Use, CONCITO.

A coherent land use strategy is needed to ensure space for both nature and renewable energy

Denmark’s climate ambitions lack space

Sources

1  https://www.rmg.co.uk/stories/topics/nasa-moon-mission-artemis-program-launch-date

2 https://www.danskindustri.dk/di-business/arkiv/nyheder/2022/7/vindmolleparker-skal-godkendes-vasentlig-hurtigere/

3 https://www.danskindustri.dk/di-business/arkiv/nyheder/2022/7/vindmolleparker-skal-godkendes-vasentlig-hurtigere/

4 https://ens.dk/sites/ens.dk/files/Basisfremskrivning/

5  https://www.skm.dk/media/9140/aktuelle-skattetal-antal-biler-i-danmark.pdf

6  https://www.vejdirektoratet.dk/pressemeddelelse/2022/der-er-alt-mange-solobilister-i-danmark

7  https://concito.dk/nyheder/vi-har-brug-accelerere-groenne-omstilling-transportsektoren

8  https://www.dst.dk/Site/Dst/SingleFiles/GetArchiveFile.aspx?fi=5337092195&fo=0&ext=formid

9  https://www.kl.dk/media/51385/kommunernes-raaderumskompas-kl.pdf (side 20)

10 https://ens.dk/sites/ens.dk/files/Energibesparelser/

11  https://synergiorg.dk/media/1623/energieffektivitet-er-foerste-skridt-ud-af-krisen.pdf

12  https://synergiorg.dk/media/1690/opdaterede-potentialer-oktober-2022.pdf

13  https://fho.dk/blog/2020/05/14/groen-omstiling-skaber-jobs/

14  https://klimaraadet.dk/da/virkemiddel/drivhusgasafgift-paa-kulstofrige-lavbundsjorder

15  https://landbrugsavisen.dk/minister-nyt-pioner-projekt-kan-s%C3%A6tte-fut-under-udtagningen-af-lavbundsjord

16  https://klimaraadet.dk/da/virkemiddel/drivhusgasafgift-paa-kulstofrige-lavbundsjorder

17  https://www.berlingske.dk/virksomheder/danskerne-gik-amok-i-elektronikkob-i-2020-og-satte-europarekord

18  https://ing.dk/artikel/danmark-dumper-indsamling-elektronikaffald-vi-ligger-paa-niveau-med-lande-slovenien

19 https://www.geus.dk/om-geus/nyheder/nyhedsarkiv/2022/maj/forsyningen-af-kobolt-til-den-groenne-omstilling-er-udfordret

20 https://ing.dk/artikel/komplicerer-omstilling-eldrevent-mangel-paa-litium-kalder-paa-massiv-genanvendelse-257554 

21  https://globalewaste.org/news/surge-global-waste/

22 https://thinkeuropa.dk/brief/2022-12-hvordan-kan-eu-sikre-tilstraekkeligt-med-kritiske-raastoffer-i-fremtiden

23 Ibid.

24 https://ec.europa.eu/eurostat/web/products-eurostat-news/

25  https://www.c4cph.dk/co2-fangst/

26 https://kefm.dk/Media/637995217763659018/ (s. 50)

27 https://concito.dk/nyheder/ny-analyse-skal-mere-fart-paa-fjerne-co2-fra-atmosfaeren

28 https://concito.dk/files/media/document/Negative%20udledninger.pdf

29 https://www.c4cph.dk/ny-rapport-hurtige-beslutninger-kan-goere-co2-reduktioner-stoerre-og-markant-billigere/

30 https://www.danskfjernvarme.dk/aktuelt/debat/arkiv/2021/211206-nationale-strategier-for-ccs-og-ccu-skal

31 https://jv.dk/haderslev/skaenderier-og-korporlige-sammenstoed-vindmoeller-gjorde-naboer-til-fjender-nu-skal-de-moedes-igen

32 https://www.altinget.dk/artikel/danmarks-areal-bliver-central-i-valgkampen-vi-skal-have-skaane-tilbage-hvis-der-skal

33 https://concito.dk/nyheder/faerre-benspaend-groenne-omstilling

The UnSustainability Report 2023 is developed by Geelmuyden Kiese in cooperation with Deloitte Economics.

Geelmuyden Kiese is one of Scandinavia’s largest communications agencies. We offer specialised advisory on sustainability communications - from strategy to message development, ESG reporting and screening of “green” messages.

Deloitte is Denmark’s and the world’s largest audit and advisory firm. Behind the report is Deloitte Economics, which offers economic advisory into the strategic decision-making processes about the sustainable transition and ESG.

If you have any questions about the report or are interested in working with us, please write to mikkel.lotzfeldt@gknordic.com or maskov@deloitte.dk


Presented by